OPEC's Production Cut: Implications and Market Reactions
In 2020, the Saudi Energy Minister warned traders against betting heavily in the oil market and promised that those who gamble on oil prices would be “ouching like hell”.
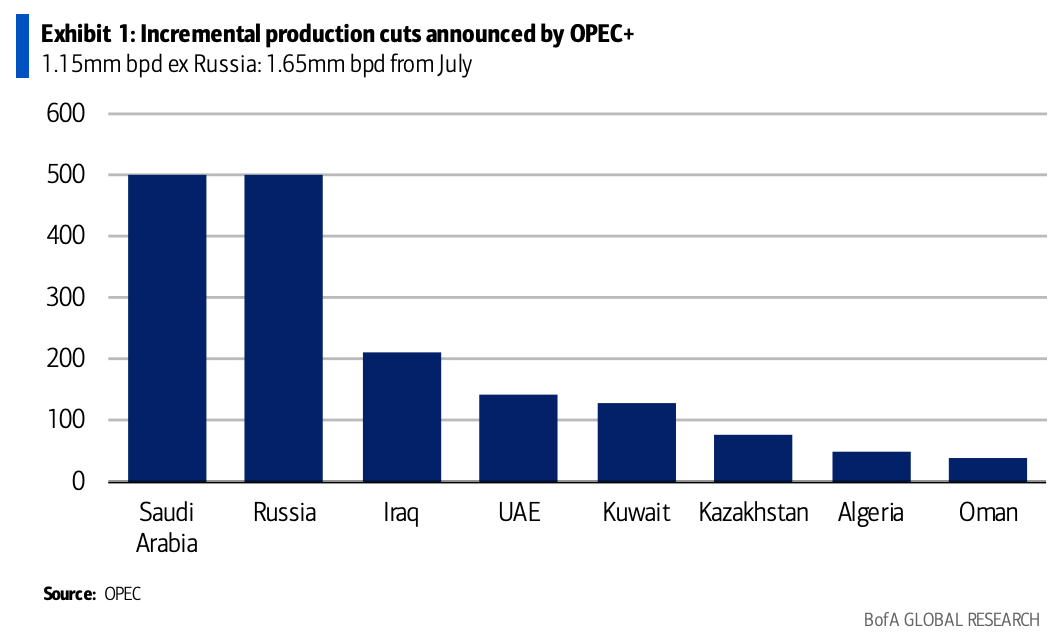
Well yesterday, OPEC+ cut oil output by more than 1 million barrels from May to year-end. The market was caught off guard as oil futures jumped as much as 8% as worries about inflation and higher gas prices were reignited.
Thanks for reading Quantitative Edge! Subscribe for free to receive new posts and support my work.
As Jim Bianco pointed out on Twitter, the shorting of oil was near record levels. The Energy Minister wasn’t kidding when he made that promise in 2020.
In addition, per the FT, the decision to cut may also have had to do with the White House’s comments last month that it would struggle to make oil purchases this year after previously offering assurances to Saudi Arabia that the U.S. would step in to make purchases if oil prices fell.
So what do we make of this production cut?
Sustainable oil market price recovery typically comes from unexpected demand increases rather than a decline in supply. Persistently high oil prices, driven by supply constraints rather than actual demand, are more likely to slow growth and weaken already declining earnings expectations.
In our current situation, I do not think that high oil prices due to artificial cuts in supply will increase demand but will instead generate a downturn in growth, as seen during the 1970s. Even though the OPEC+ cut gave short-term support for oil prices, it might be net bearish. Here’s the argument for why this could be the case:
The cuts were made in reaction to falling oil prices, emphasizing that OPEC+ are 'price-responders' rather than 'price-makers.' This means that OPEC+ only reduces supply after oil prices have already weakened and are unlikely to implement further cuts unless prices drop even lower, meaning oil prices would likely have to fall significantly for OPEC+ to consider another supply reduction.
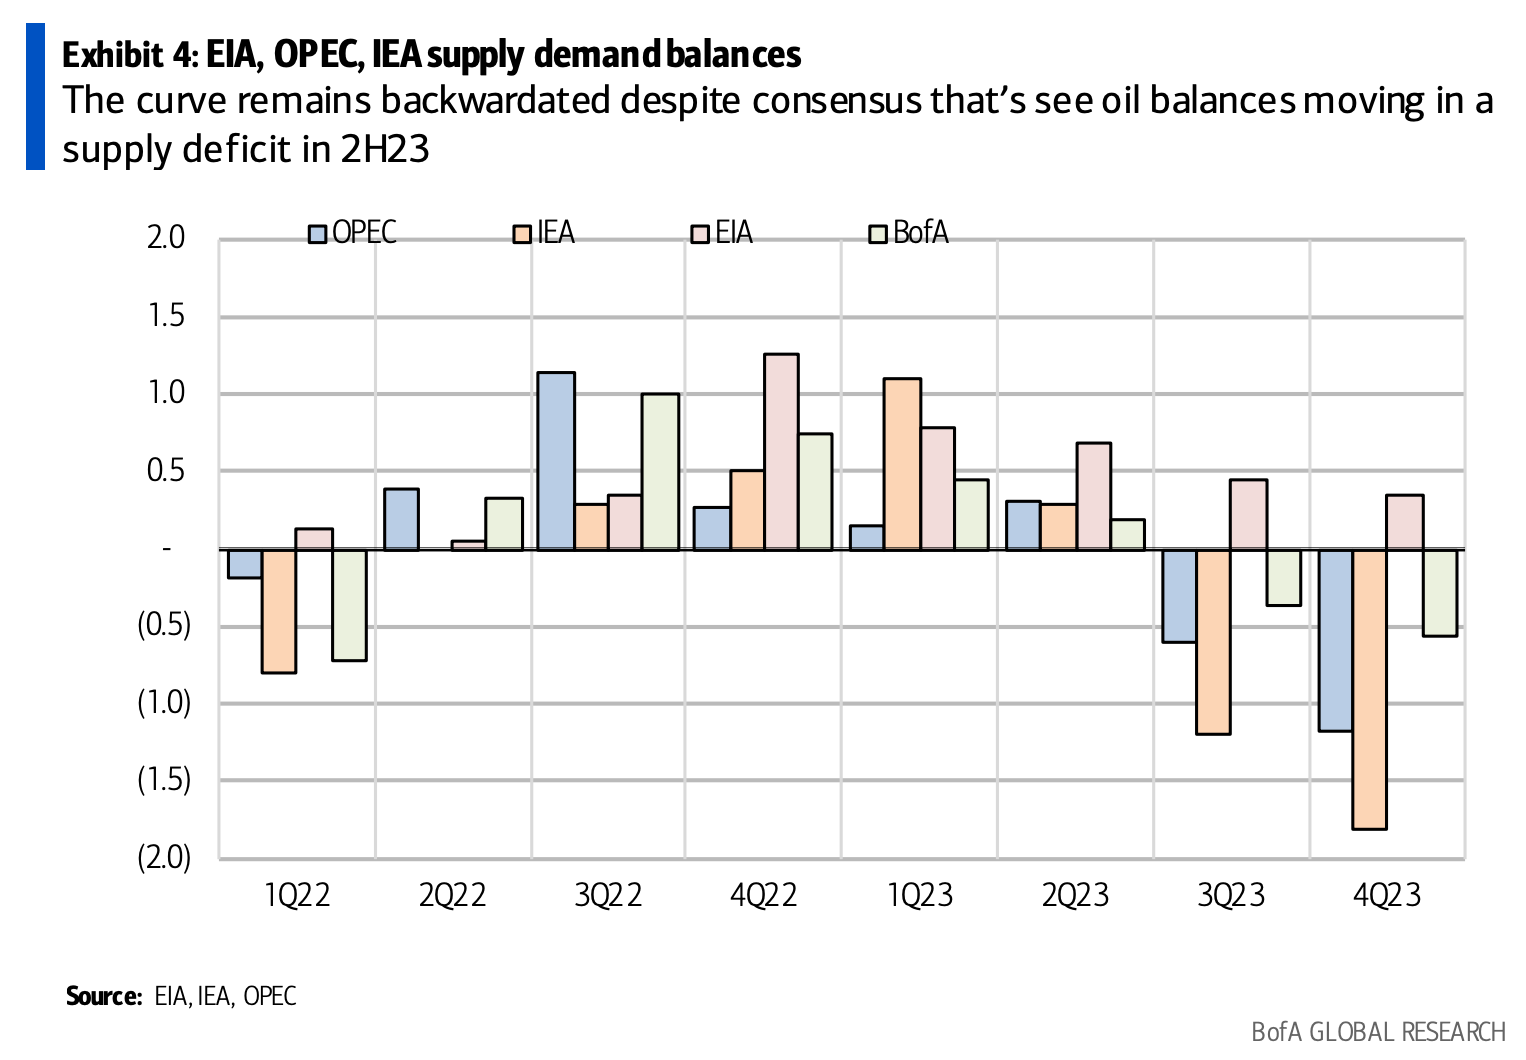
The market certainly believes this to be the case as the oil futures forward curve is deeply backwardated.
A backwardated curve is a term used in the commodities market to describe the price structure of a futures or forward contract over time. In a backwardated market, the prices of futures contracts with nearer expiration dates are higher than those with later expiration dates.
One of the reasons backwardation can occur is supply shortages (or cuts). If there's an immediate shortage of a commodity, the spot price (the current price in the market) is likely to rise, causing the near-term futures contracts to trade at a premium compared to contracts with later expiration dates. As the supply issue is resolved over time, the market expects future prices to normalize, resulting in a backwardated curve.
The chart below displays what a backwardated curve looks like.
As a result of the cuts, Goldman raised their Brent PT to $95 while BofA reiterated its $80 PT.
“While liquidity is the practical headwind to recognizing the curve as a reasonable indicator of price, it nevertheless stands as a benchmark on what the market might be prepared to discount. It is the gap between these two (long-term $80 Brent and a steeply backward-dated forward curve) that we believe is the value opportunity within the US oils and has anchored our view since the COVID trough over the past three years.” - BofA
Citi had an interesting note today arguing that the cuts would prove to be disinflationary…
“What’s going to drive consumer sentiment and also consumer spending? If we’re in an environment where energy, where gasoline, is going to be more expensive because of these production cuts, then that very quickly changes the consumer spending patterns and behaviors, and the areas where we’ve seen those types of pressures obviously have been from an inflationary standpoint more services focused. This could show a more material decline in consumer spending in those areas if we see this ultimately flowing through to gasoline prices and forcing consumers to make some challenging decisions as we embark upon the spring and summer months.” - Citi
It’ll be interesting to see how this all plays out.
Finding Alpha in a Macro-Driven Market
I came across an interesting report from Goldman Sachs on ‘How to find alpha in a macro market’.
“Recent banking sector stress is maintaining a very macro-driven source of dispersion. Higher market volatility offers a wider performance spread, but it is challenging for stock pickers to capture it, based on companies’ fundamentals. Interest rate swings tend to generate greater dispersion across sectors and factors than across stocks within a sector. In such macro environments, macro hedge funds typically outperform long/short ones. For the environment to become more supportive to stock picking, we need a moderation in inflation and rate volatility, and reduced policy uncertainty.” - Goldman
In the report, it noted that “alpha opportunity has continued to improve since last summer, and now ranks in its 44th percentile”. Dispersion (the spread of returns) adjusted for volatility has also risen and now stands close to the 70th percentile of its historical range.
Alpha is a measure of an investment's performance relative to a benchmark, such as the S&P 500. It indicates the ability of an investor to generate returns above the market average, essentially representing the value added by the investor’s skill in stock selection.
Dispersion, which refers to the spread of returns among different stocks, has also increased when adjusted for volatility. This means that the range of performance outcomes among different stocks has widened, providing more opportunities to find potential winners.
So where should we direct our stock-picking efforts in a macro-driven market?
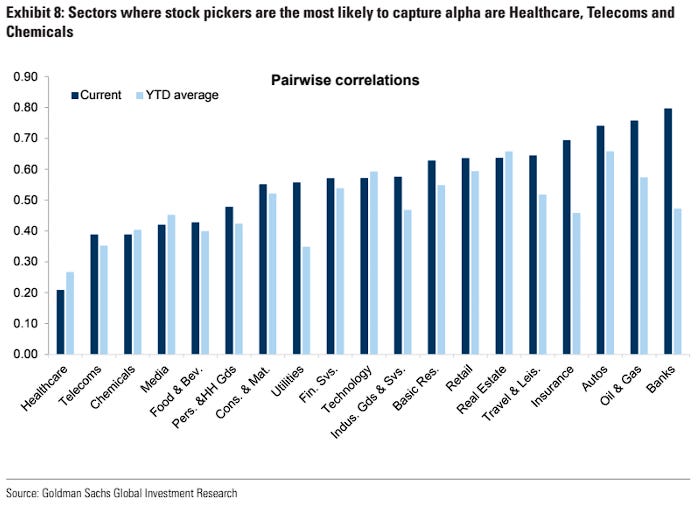
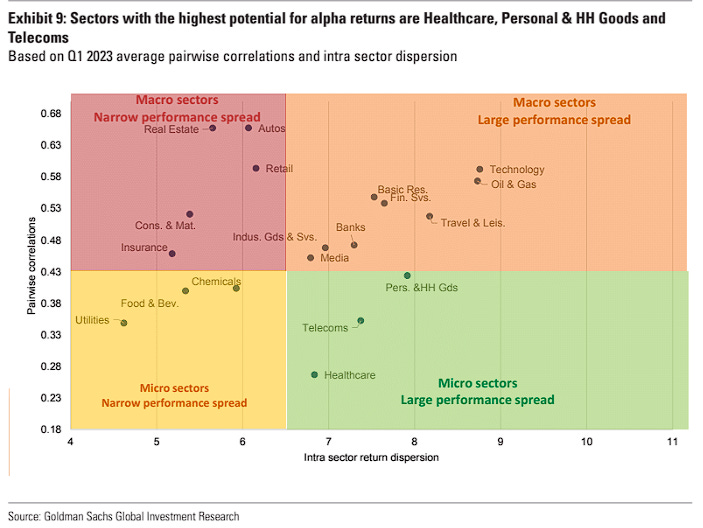
The best sectors for stock picking are Healthcare, Telecoms, and Personal & Household Goods: they are micro sectors within which stocks do not move altogether in the same direction (low pairwise correlations) and also offer large performance spreads.
The second-best sectors for stock picking are Food & Beverages, Chemicals, and Utilities: they are also micro sectors (low pairwise correlations), but offer lower performance spreads than the group above.
The Case for Staying Invested
There’s a lot of fear in the markets but despite all the negative headlines, it’s still better to stay invested. Here are some charts and facts as to why.
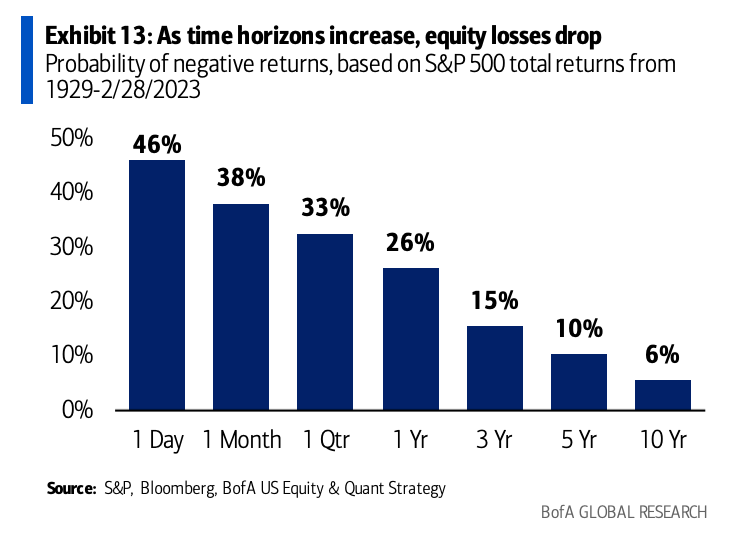
The probability of losing money in the S&P 500 over one day is a little worse than a coin flip (46%), but the probability declines to just 6% over a 10-year time horizon, based on data back to 1929.
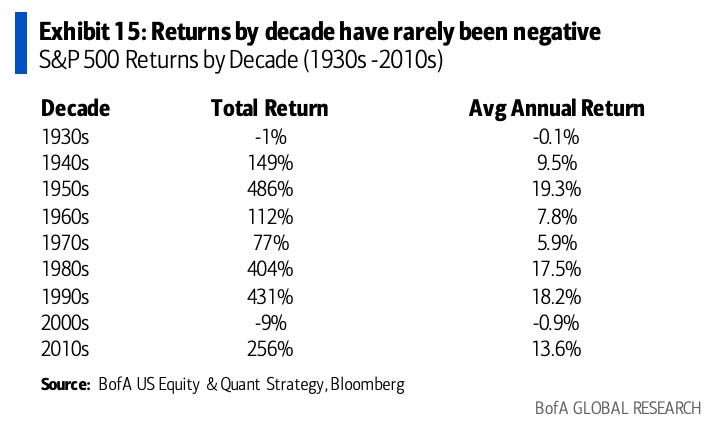
Negative 10-yr stock returns are rare. Outside of the 1930s, the 2000s was the only decade with negative total returns.
Since the 1930s, if an investor sat out the 10 best return days per decade, his/her returns would be just 33% compared to ~18,761% returns from remaining invested.
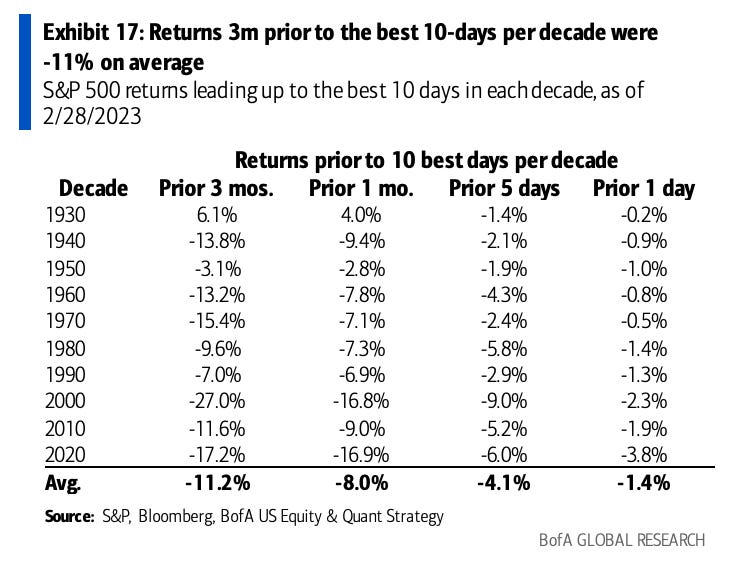
The best periods for stocks often follow the worst periods. Returns leading up to the best 10 days in each decade were deeply negative (-11% in the prior 3 months, on average).
Recovering bear market losses has historically required remaining invested for about 1,100 trading days (over four years), but some market recoveries, like in 2020, have been much swifter.
Thanks for reading Quantitative Edge! Subscribe for free to receive new posts and support my work.