

Core Inflation Rises Most in 5 Months, Student Loan Restart, Market Technicals, and More
Core Inflation Rises Most in 5 Months, Student Loan Restart, Market Technicals, and More

There weren’t any major surprises in February headline/core CPI, which was released yesterday.
Headline MoM inflation was 0.4%, in line with estimates
Headline YoY inflation was 6% , in line with estimates
Core MoM inflation was 0.5%, higher than expectations of 0.4%.
Core annual inflation was 5.5%, in line with estimates.
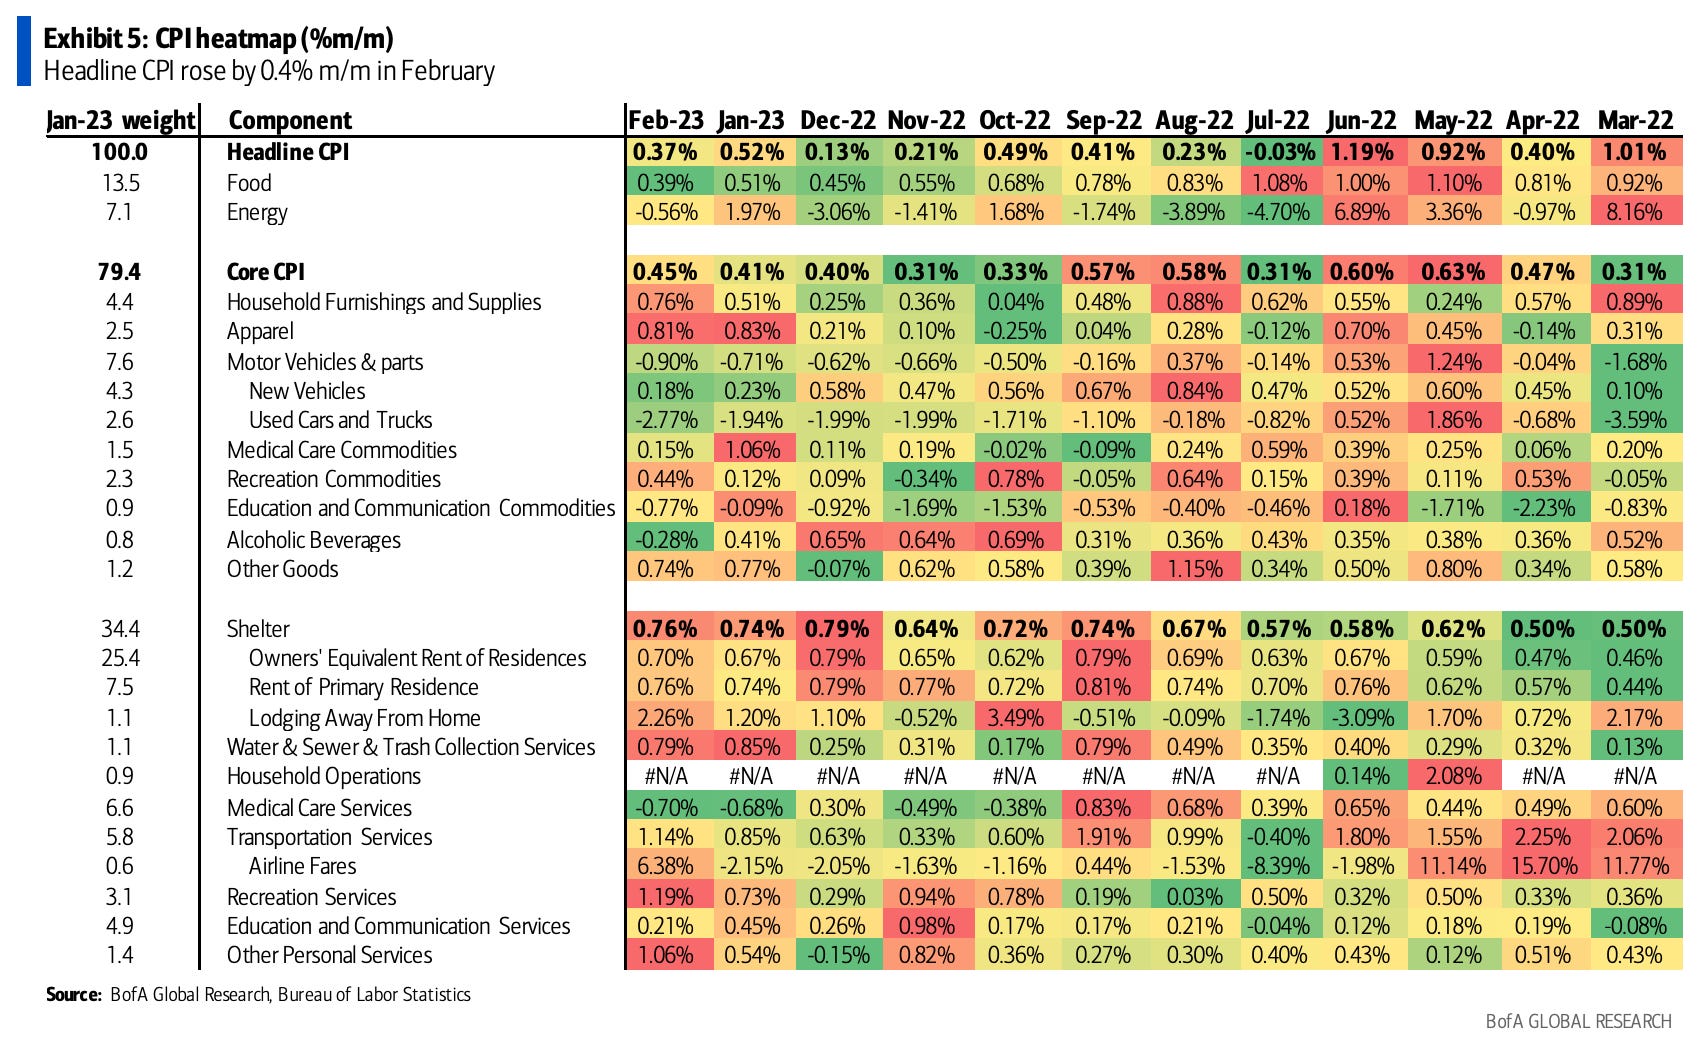
Breaking down the report by segment, food prices rose by 0.4% MoM, slightly below expectations, with food-at-home inflation declining due to falling commodity prices and transportation costs. Energy prices fell by 0.6% MoM, driven by a decline in energy services. Core inflation increased by 0.45% MoM, driven by a rise in core services inflation, particularly in shelter inflation. Over 70% of inflation growth was due to shelter inflation.
DataTrek pointed out in its research note that Jerome Powell and the FOMC are keenly focused on “non-housing core service inflation”, which is still showing extremely elevated prices…
Medical Care Services (28% of non-housing core services): 2.1% annual inflation
Transportation Services (24%): 14.6% inflation
Education and Communication Services (21%): 2.9% inflation
Recreation Services (13%): 6.3% inflation
Other Personal Services (6%): 5.2% inflation
The weighted average of these components comes out to 5.8%. Remember that the Fed’s inflation target is 2%.
The Atlanta Fed divides CPI into components whose prices are flexible, meaning they can be moved up or down quickly with little difficulty, and those that are sticky, where price rises take a while to prepare and are hard to reverse.
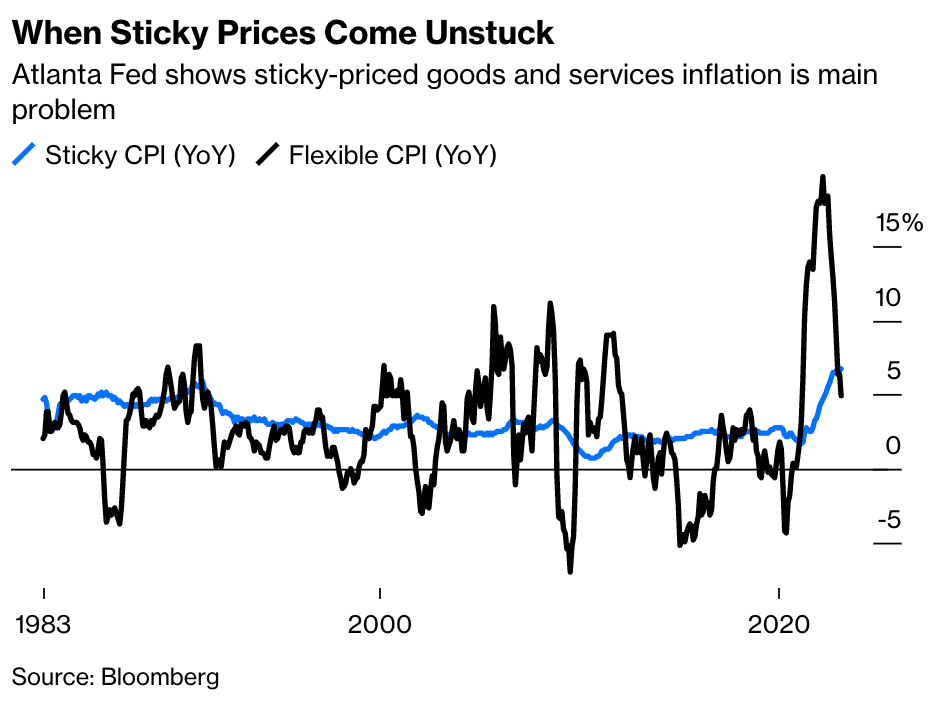
In 2021 and early 2022, inflation was almost entirely due to flexible pricing. Now, sticky price inflation is actually higher than flexible, and remains at an elevated level. This is exactly what the Fed wanted to avoid.
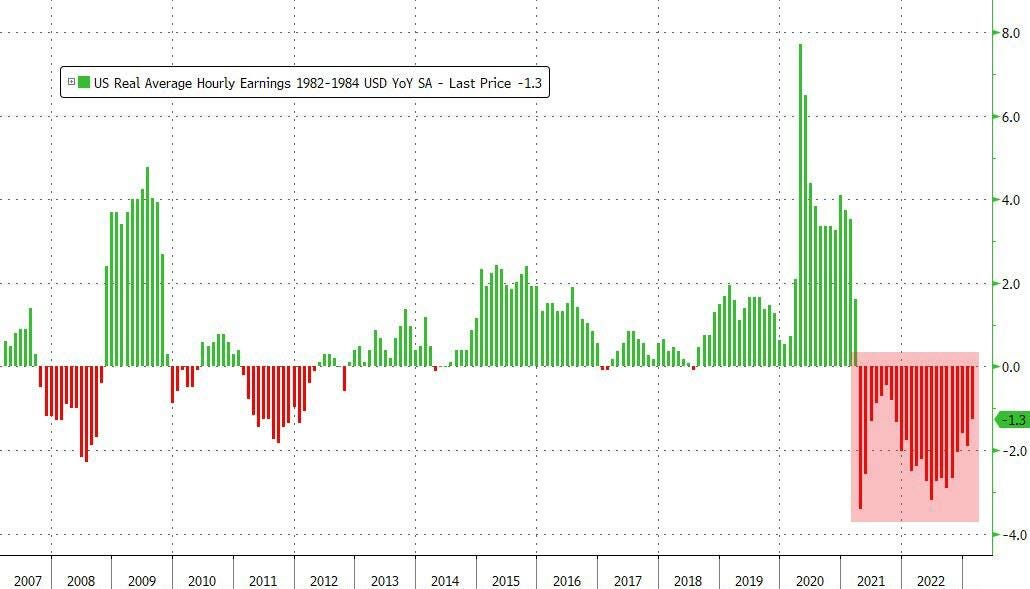
Meanwhile, February was the 23rd straight month where Americans' cost of living has outpaced wage growth with real average hourly earnings down 1.3% YoY…
The Fed has a pretty tough decision in March as it balances fighting sustained inflation and maintaining stability in the banking sector.
Tuesday saw a massive move in Fed funds futures as the market is now back to expecting a terminal rate of 5%, with one more hike after next week before rate cuts as soon as the summer.
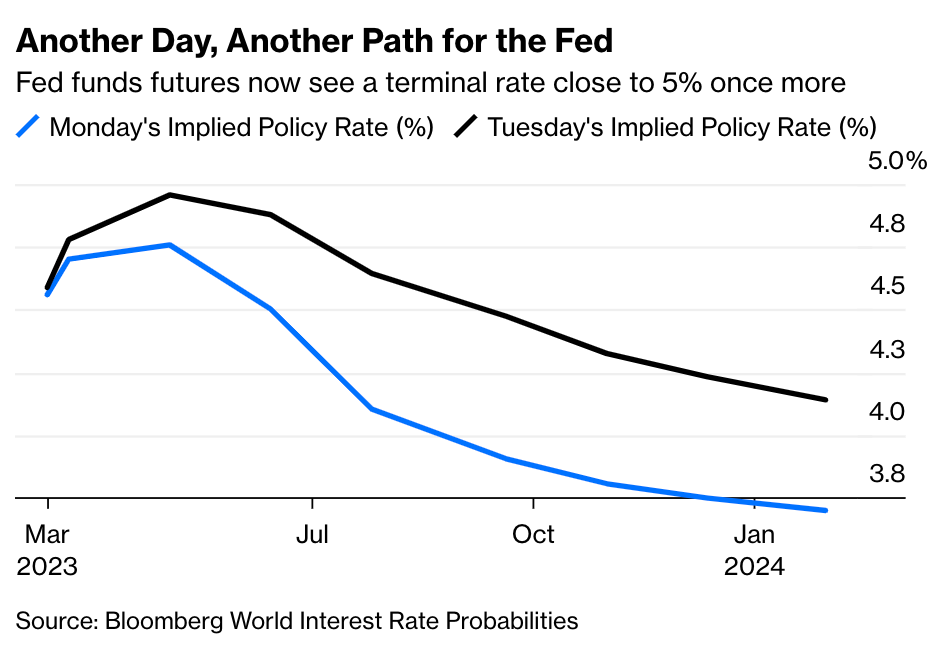
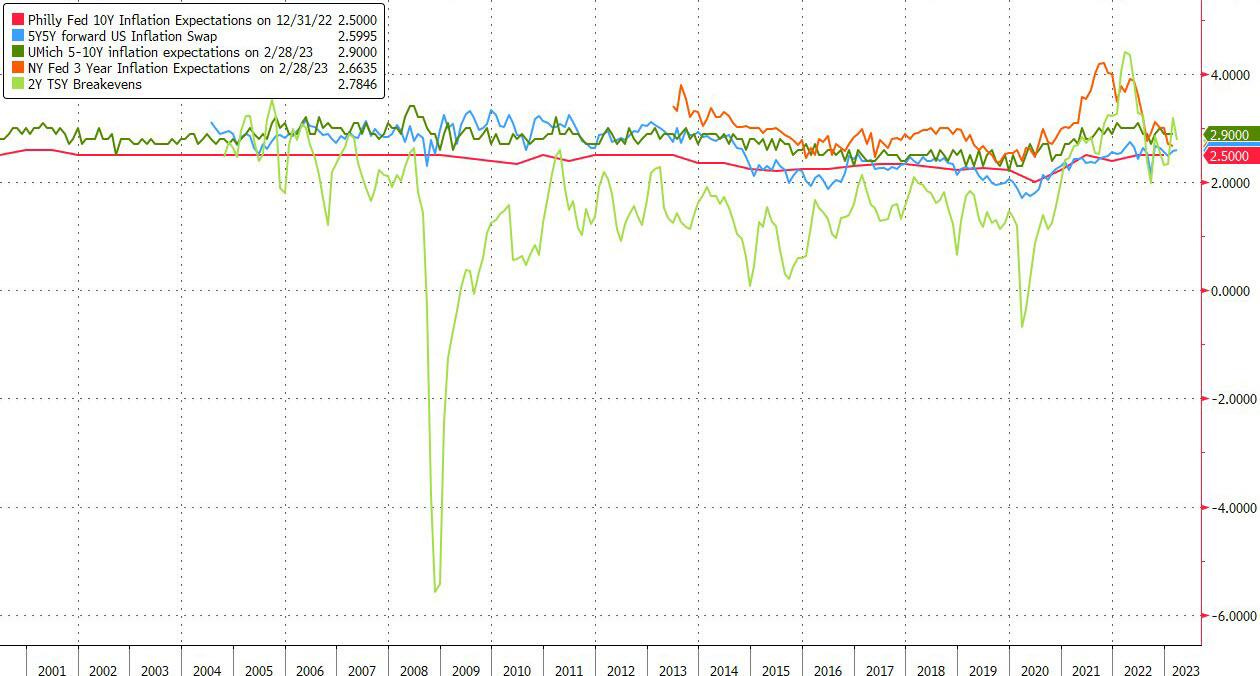
The market seems to expect the Fed to accept above-target inflation as breakevens and inflation swaps still show inflation expectations above 2%.
Student loans are expected to restart this summer after the Supreme Court acts on litigation challenging Biden’s plan for mass student debt cancellation. In total, about 40 million borrowers hold $1.6 trillion in federal student debt, with many of them owing hundreds of dollars a month.
However, this restart of loan repayments could especially add pressure on younger borrowers, who haven’t made payments on student loans since March 2020.
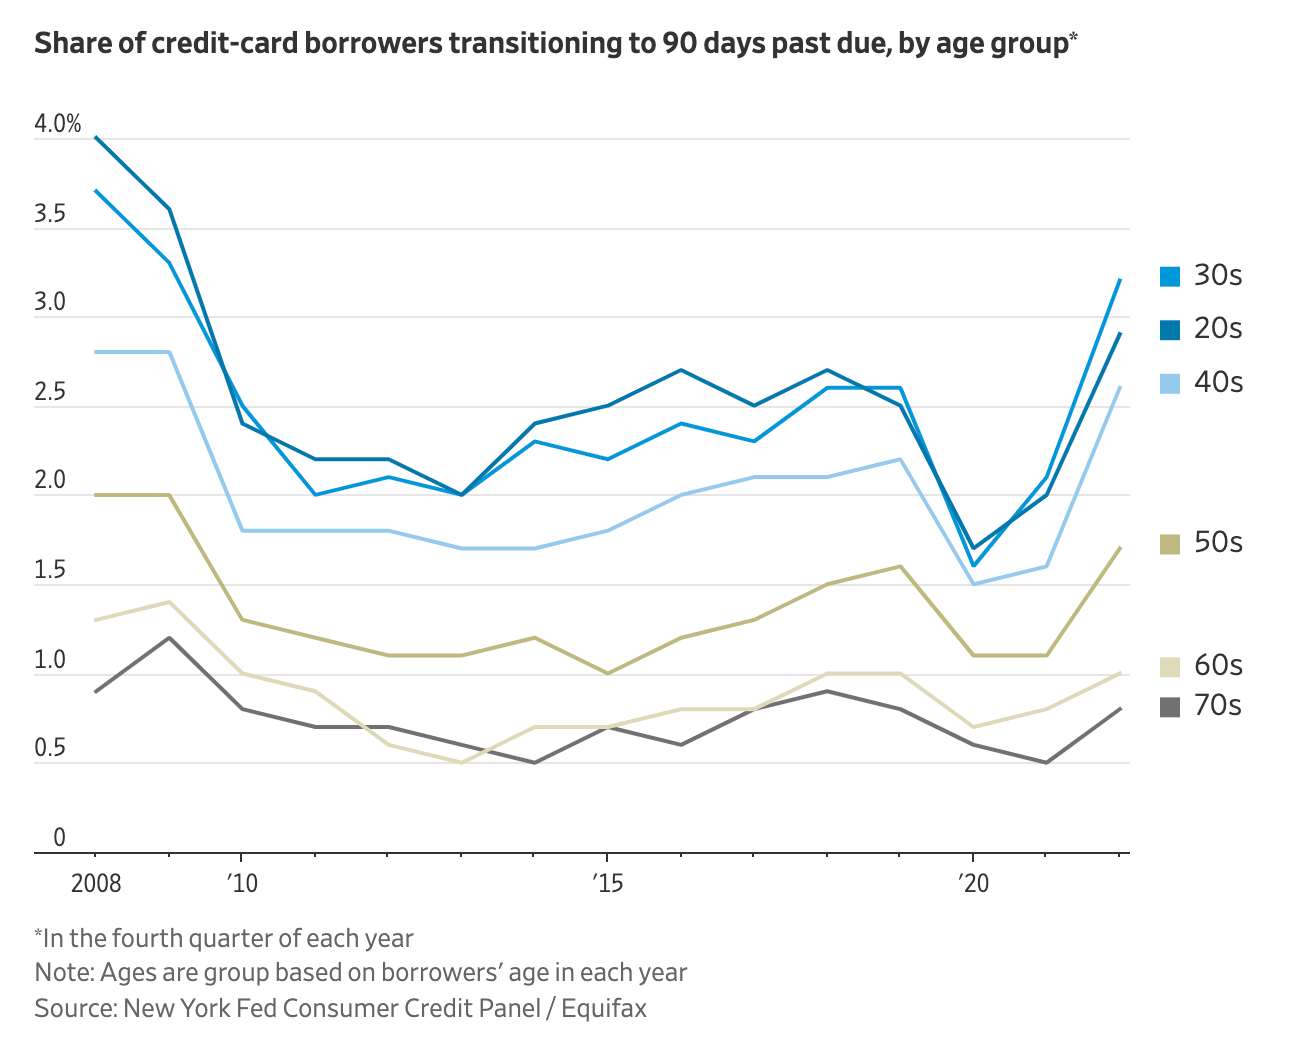
In the fourth quarter, Americans in their 30s and younger fell behind on credit-card payments by 90 days or more at a rate similar to that in 2009, at the end of the financial crisis. Those borrowers also hold more than 54% of outstanding student-loan debt.
Despite this, they continue to spend.
Outstanding consumer debt for borrowers ages 18 to 29 rose 34% in the fourth quarter, from the first quarter of 2021, while borrowers ages 30 to 39 accumulated 25% more debt.
That compares with an 11% increase in outstanding debt among those 40 and up.
A Government Accountability Office report last year also estimated that about 50% of borrowers would be at risk of delinquency and default when the payment suspension ends.
Still thinking soft landing?
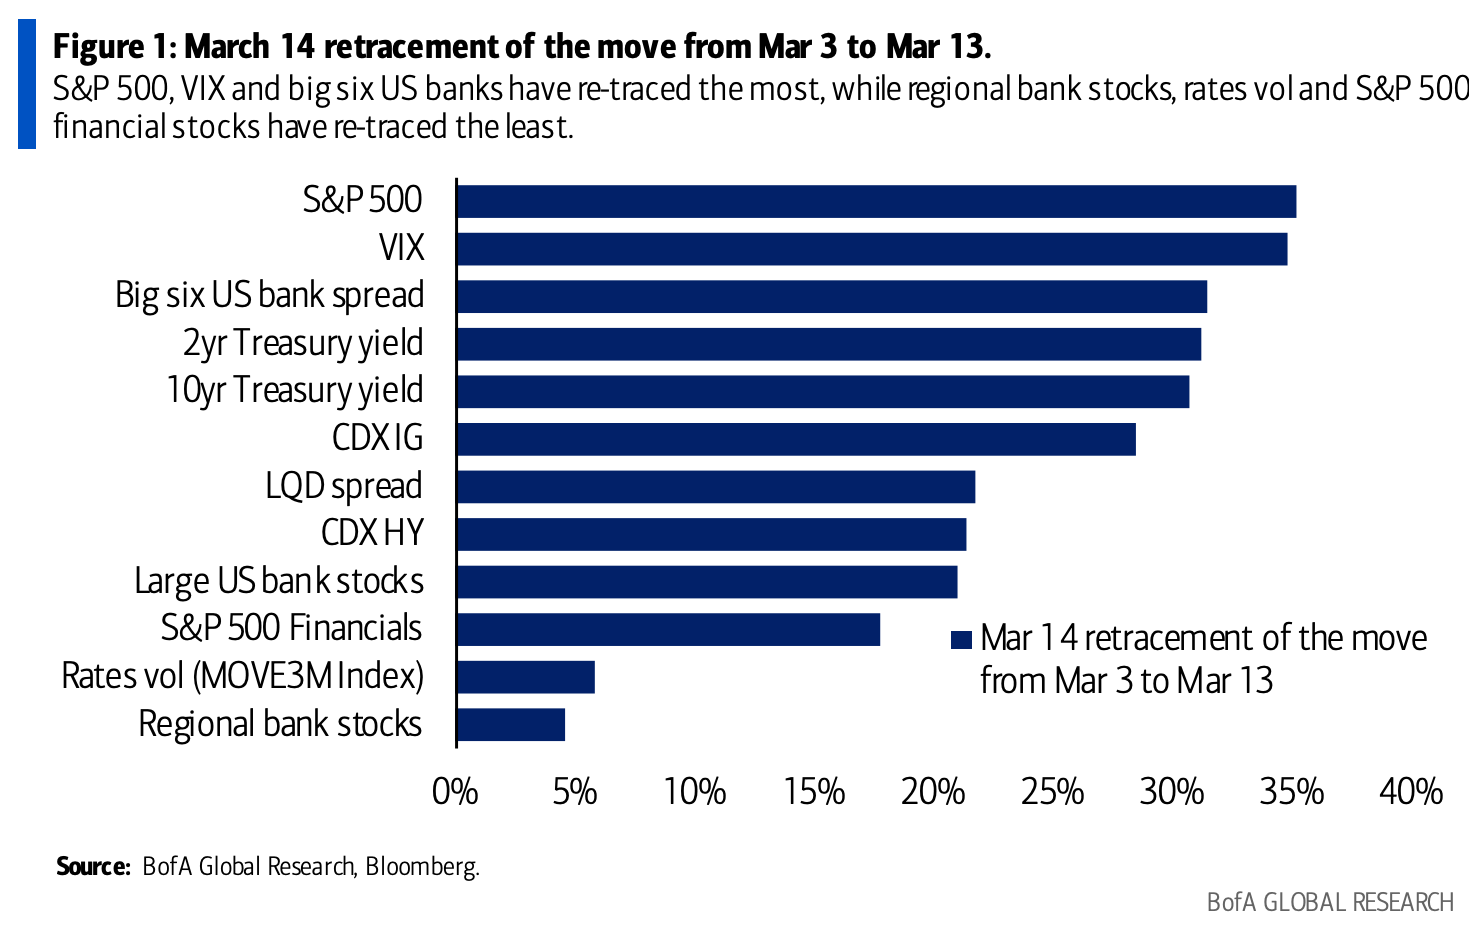
The markets were able to recover some of the losses from last week and Monday, due to the combination of no further bank failures and a CPI report for February that was mostly in line with expectations. Equity risk performed better, with the VIX decreasing by 35%, while regional bank equities underperformed. For now, it seems like systemic contagion will be avoided.
The regional banks that underperformed the most on Monday were also the banks that rallied the most on Tuesday

Despite the recovery, volatile price action remains and according to Goldman, is due to market technicals.
S&P 500 e-mini top-of-book depth (proxy for liquidity) is at $2mn, the lowest level since March 2020. Even though Monday was the busiest day in 2023 volume-wise, liquidity was at its lows. In other words, big-time volume was moving around and it was costing a lot to move stuff around, hence the insane volatility.

On Friday, 37.4mn put option contracts were traded, the largest number of puts traded in history. On Monday, another 27.3mn put option contracts, the 8th largest put option volumes in history.

Lastly, I came across an extremely interesting segment in BofA’s monthly “RIC Report” that I wanted to share:
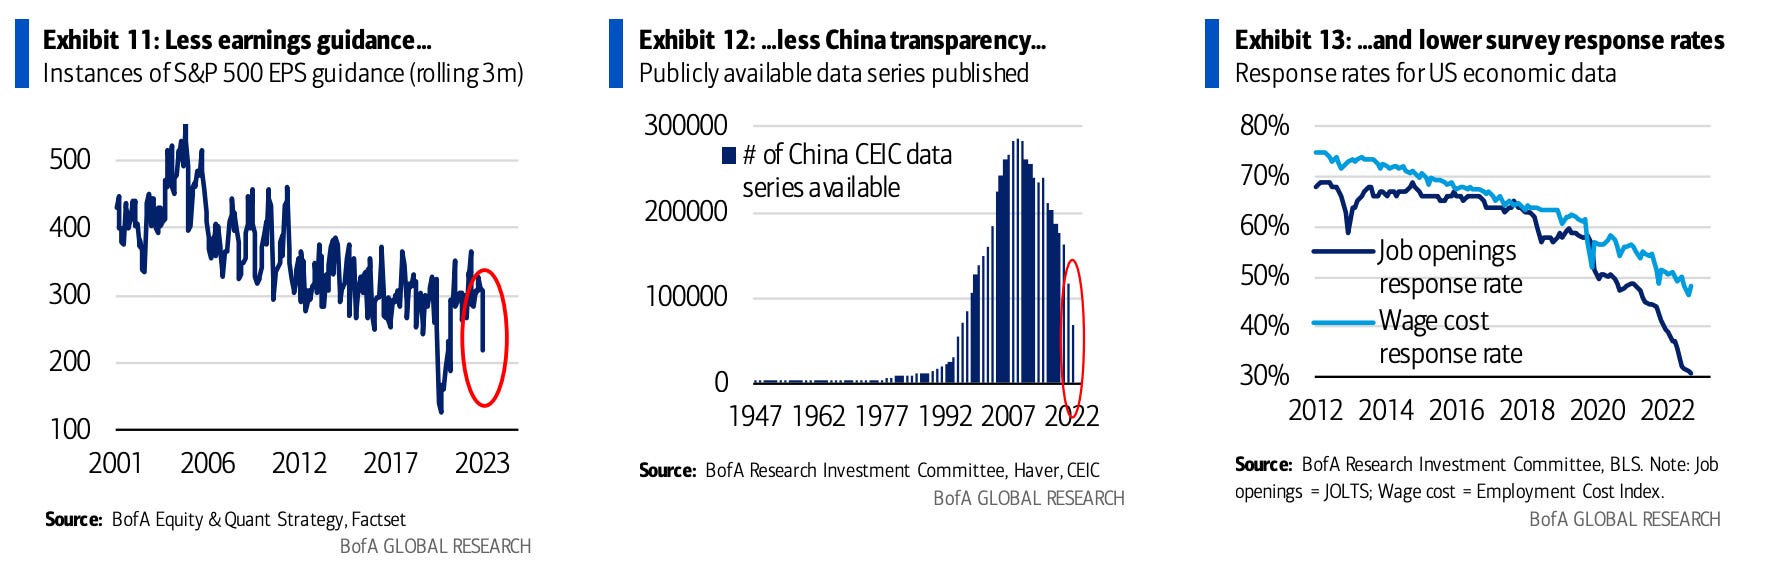
Earnings guidance for S&P 500 companies is at its lowest level since Covid and has been trending lower over the past two decades (Exhibit 11).
Chinese government economic data has become less transparent, with 50% of the series no longer being updated in the widely used CEIC database (Exhibit 12). Data availability peaked in 2010 and has fallen by 76%. For example, just 15% of loan series in major provinces are current; only 53% of flow of funds data series are updated through 2021, with no data for 2022; only 2% of the population data series that were available in 2020 have been updated.
US government economic data has not been immune, with survey fatigue evident in some of the most widely followed indicators. The Employment Cost Index (ECI), part of the establishment survey, and JOLTS, a popular jobs survey, have seen response rates plummet to record lows (Exhibit 13).
Sources
Research from Bank of America, DataTrek, Goldman Sachs
https://www.zerohedge.com/markets/cpi-slows-expected-americans-real-wages-drop-32nd-straight-month
https://www.zerohedge.com/markets/investors-expecting-fed-accept-entrenched-inflation